A1Radar Interface Tour
Learn the main areas of A1Radar: dashboard, chart detail pages, filters, watchlist, and search.
A1Radar Interface Tour
The A1Radar interface is designed around a "scan signals first, dive deep later" workflow. You should start with the overview dashboard, and then open specific chart detail pages when you need to audit anomalies.
1. Dashboard
The Dashboard is where you get a quick snapshot of overall market conditions and key indices.
When opening the dashboard, focus on:
- Market / Chain Health: Is the overall market strong, weak, or noisy?
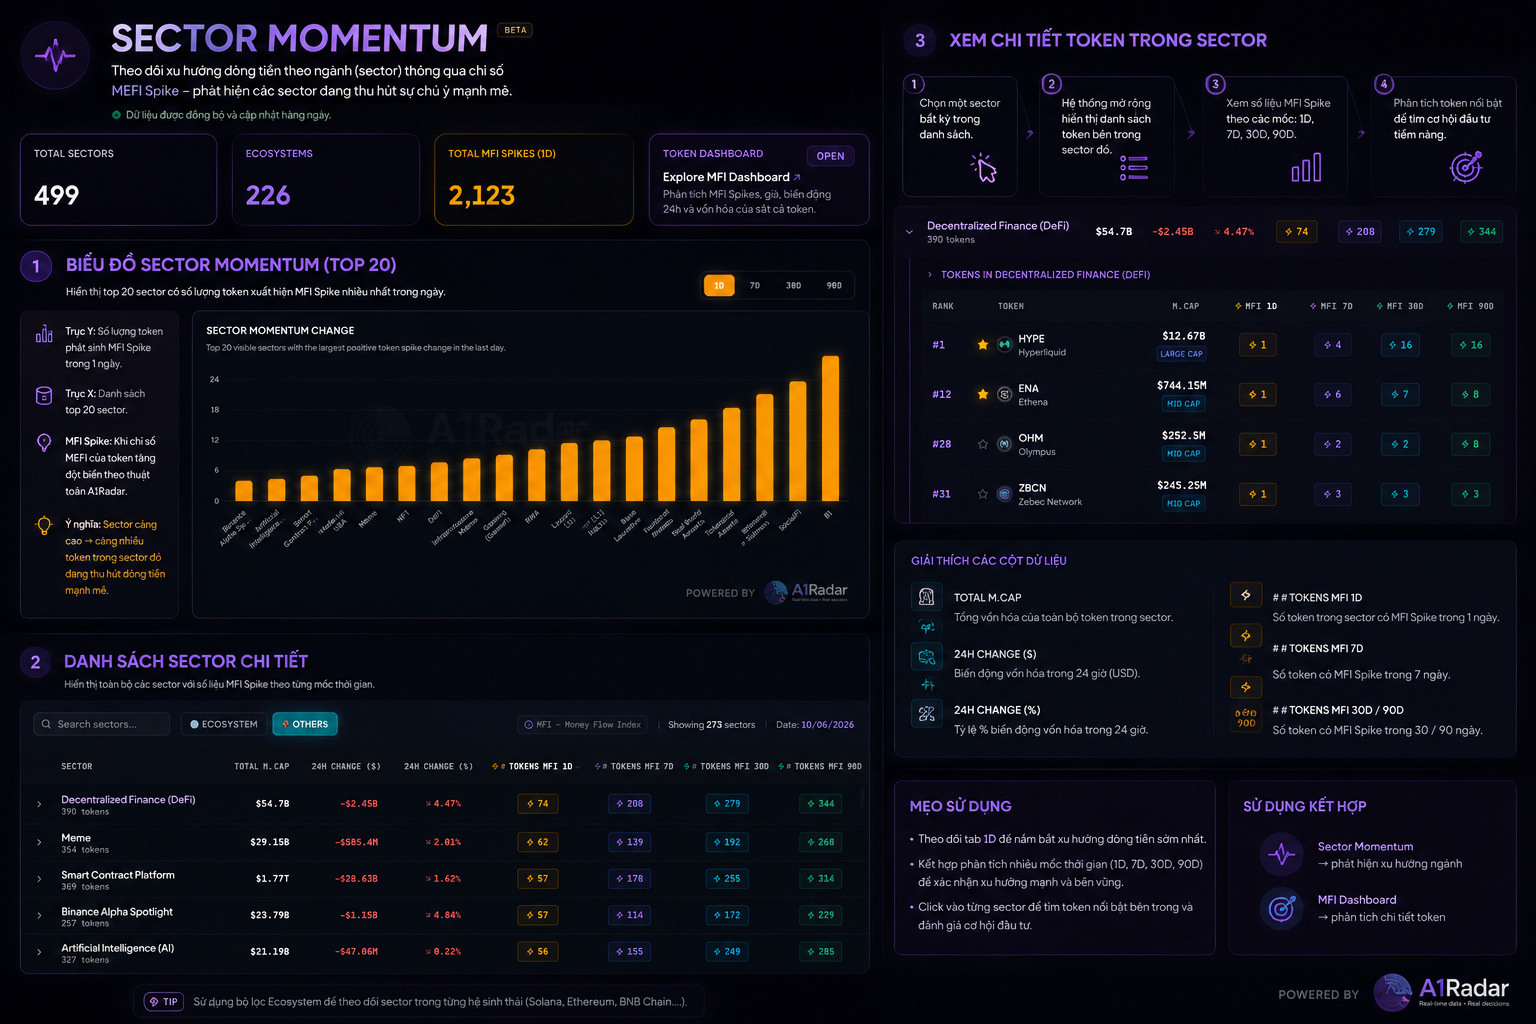
- Sector Momentum: Which narrative has outstanding capital flow?
- Strategic Traders: Are professional wallets accumulating, distributing, or holding?
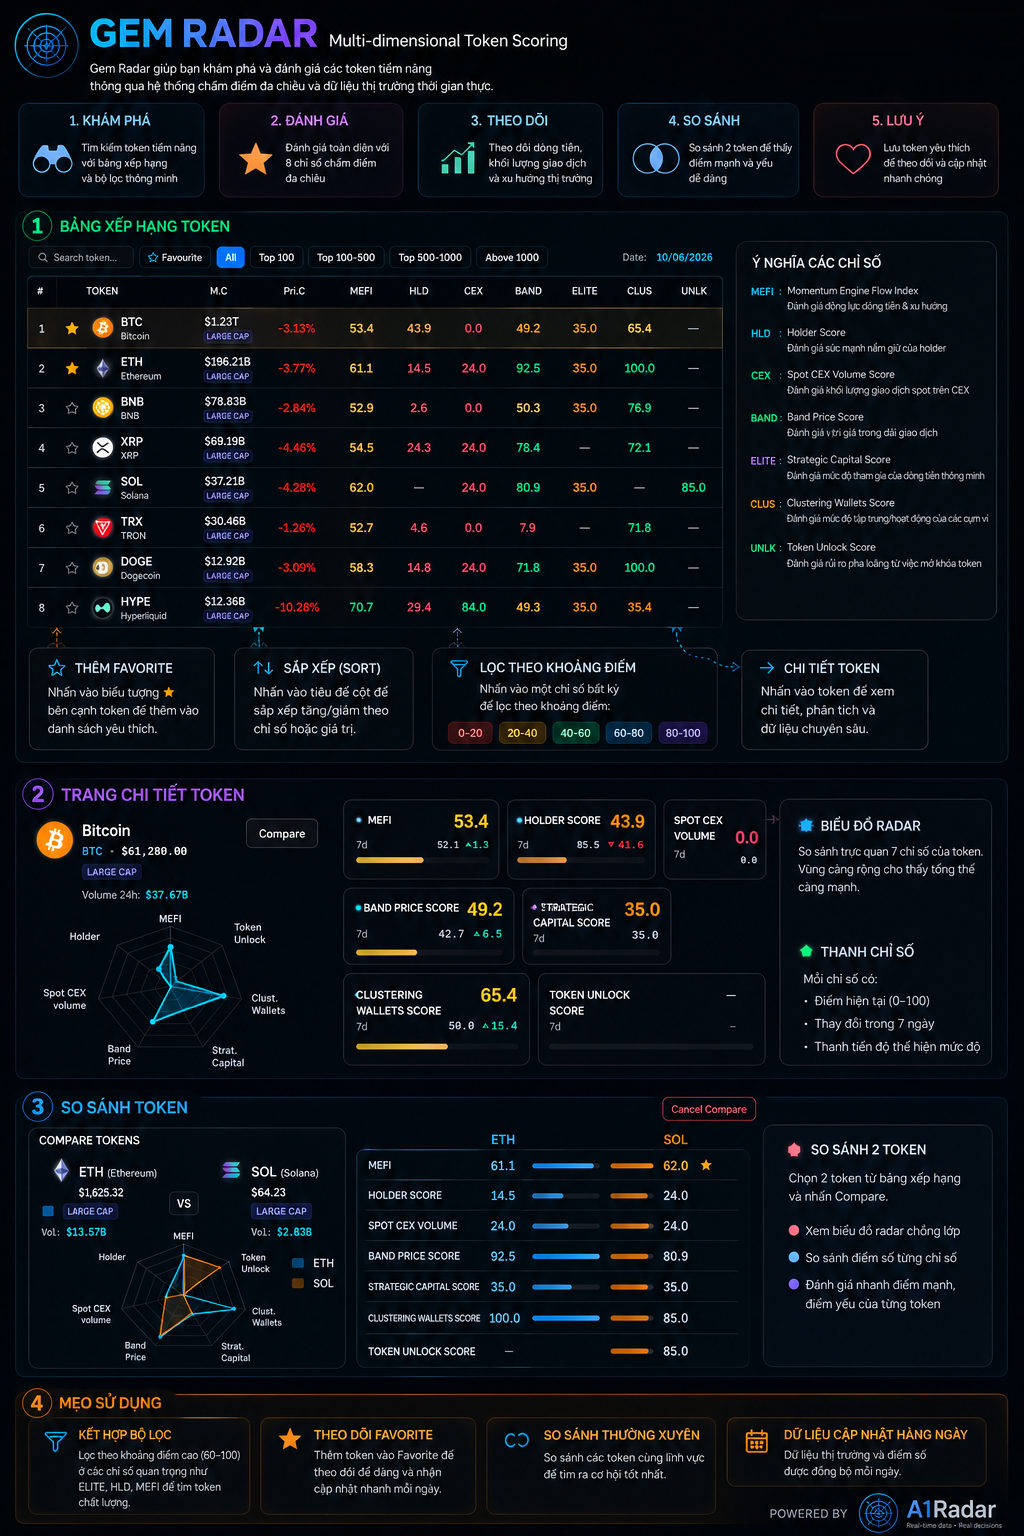
- Token Scoring: Which tokens have the highest scores or largest rating shifts?
Do not try to read all charts at once. Search for abnormal signals first.
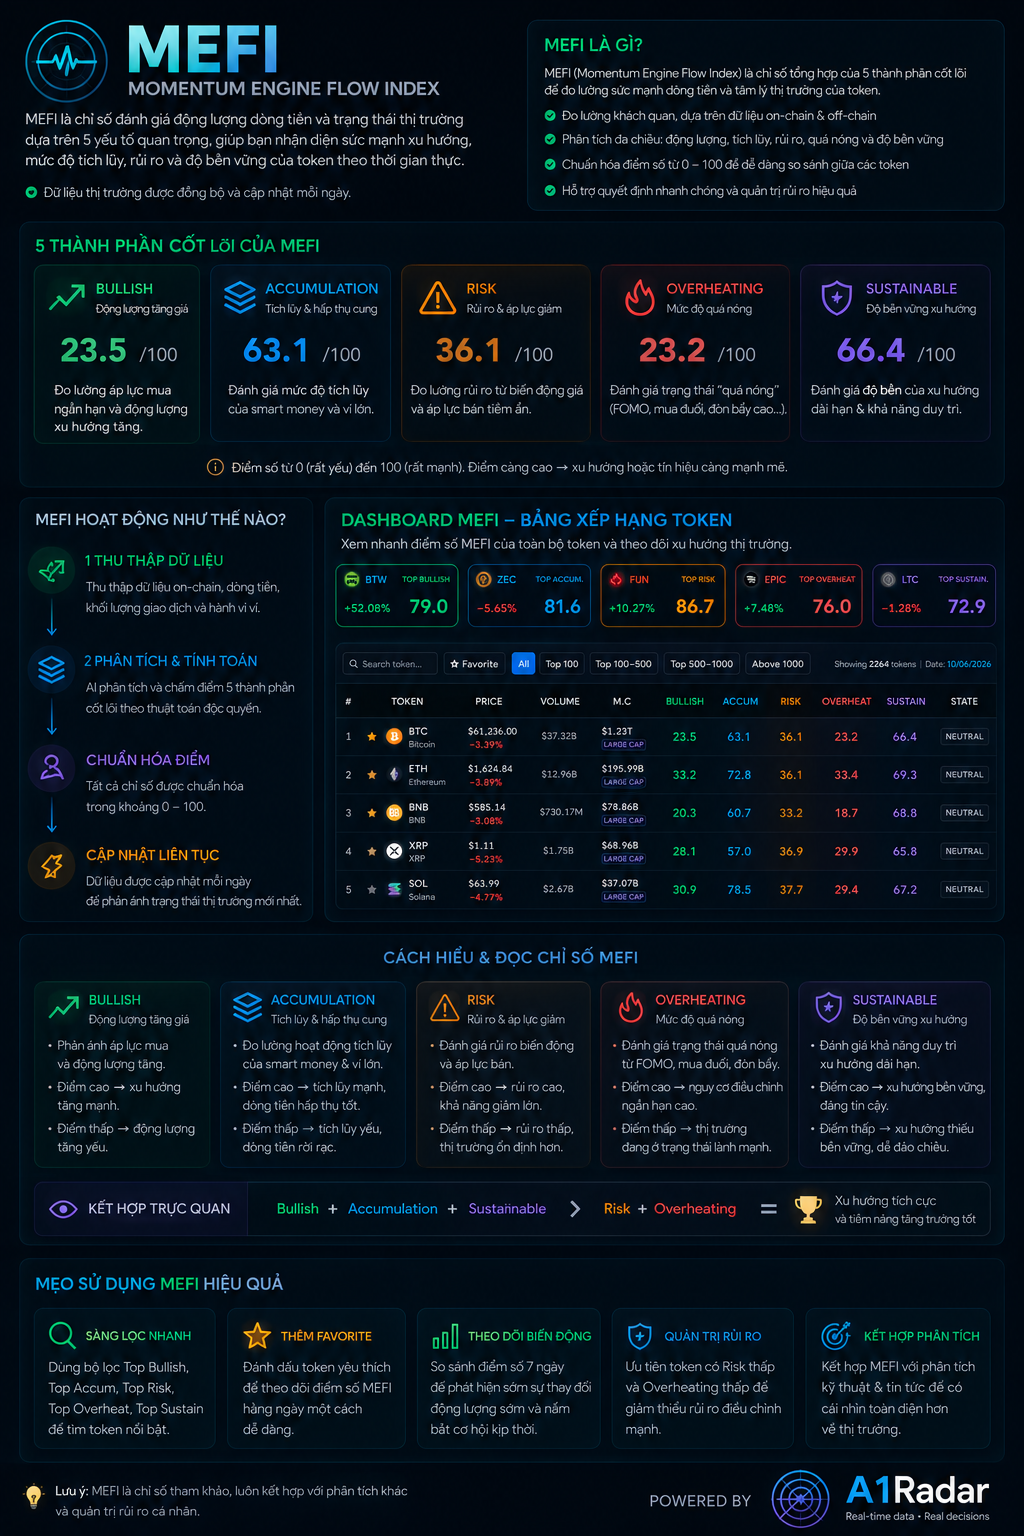
2. Signal Tables
A1Radar features signal tables to help you scan the market quickly. The MEFI table is a classic example: each token is scored across multiple dimensions including bullish strength, accumulation, risk, overheating, and sustainability.
When reading signal tables, filter from broad to narrow:
- Start with market cap groups or your watchlist.
- Search for tokens with multiple columns aligning in the same direction.
- Avoid tokens with high momentum scores if their risk or overheating scores are also high.
- Open the token's chart detail page before adding it to your trade checklist.
3. Chart Detail Page
Each chart detail page typically includes:
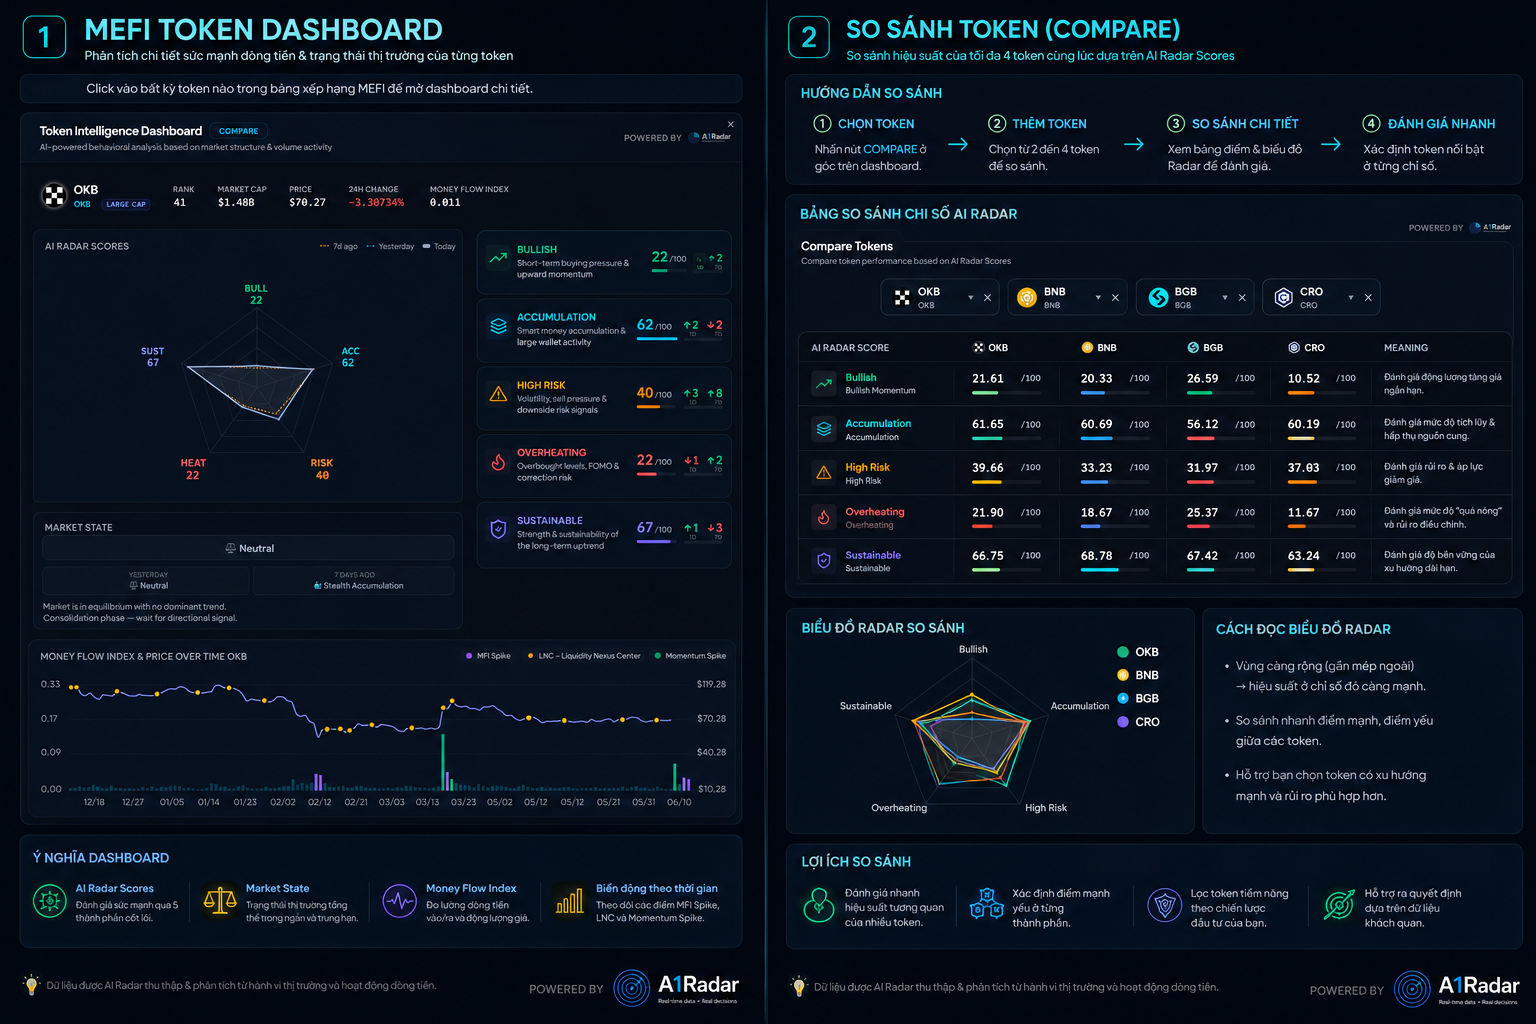
- The main interactive chart.
- Filters for token, chain, sector, or timeframe.
- A legend to toggle specific data series on and off.
- Description cards detailing how to read the indicator.
When reviewing a chart detail page, answer 3 questions:
- Is this indicator trending up, down, or sideways?
- Which token/chain/sector is driving the change?
- Is this signal confirmed by other indicators?
4. Filters
Filters help eliminate market noise. Instead of looking at the entire market, you can focus on:
- A specific chain like Ethereum, BNB Chain, Solana, or Base.
- A single token in your watchlist.
- A sector showing active momentum.
- A timeframe matching your trading horizon.
[!TIP] If a chart feels cluttered, toggle off series in the legend or filter down to a single chain/token first.
5. Watchlist
Use the Watchlist to aggregate the tokens you want to monitor closely.
Add tokens to your watchlist when:
- The token appears in multiple positive signals.
- The token shows notable inflows from Strategic Traders.
- The token belongs to a sector showing active momentum.
- The token has upcoming unlock risks that need tracking.
6. Search
Search helps you quickly open documentation or related content. On the docs site, press ⌘K or click the search box to find:
- Indicator names.
- Feature guides.
- Terms like MEFI, DSSI, unlock, netflow, or holders.
In the main application, use the search bar to jump straight to a specific token or chart.