Strategic Traders Flow Analysis
Evaluate capital flows, liquidity changes, and token age distributions of the Strategic Traders cohort.
Last updated: June 19, 2026
Strategic Traders Flow Analysis
Strategic Traders Flow Analysis is a macro market indicator that tracks the sentiment, risk appetite, and capital rotation of the Strategic Traders cohort (vetted smart wallets with high historical win-rates) across 4 major networks: Ethereum, BNB Chain, Solana, and Base.
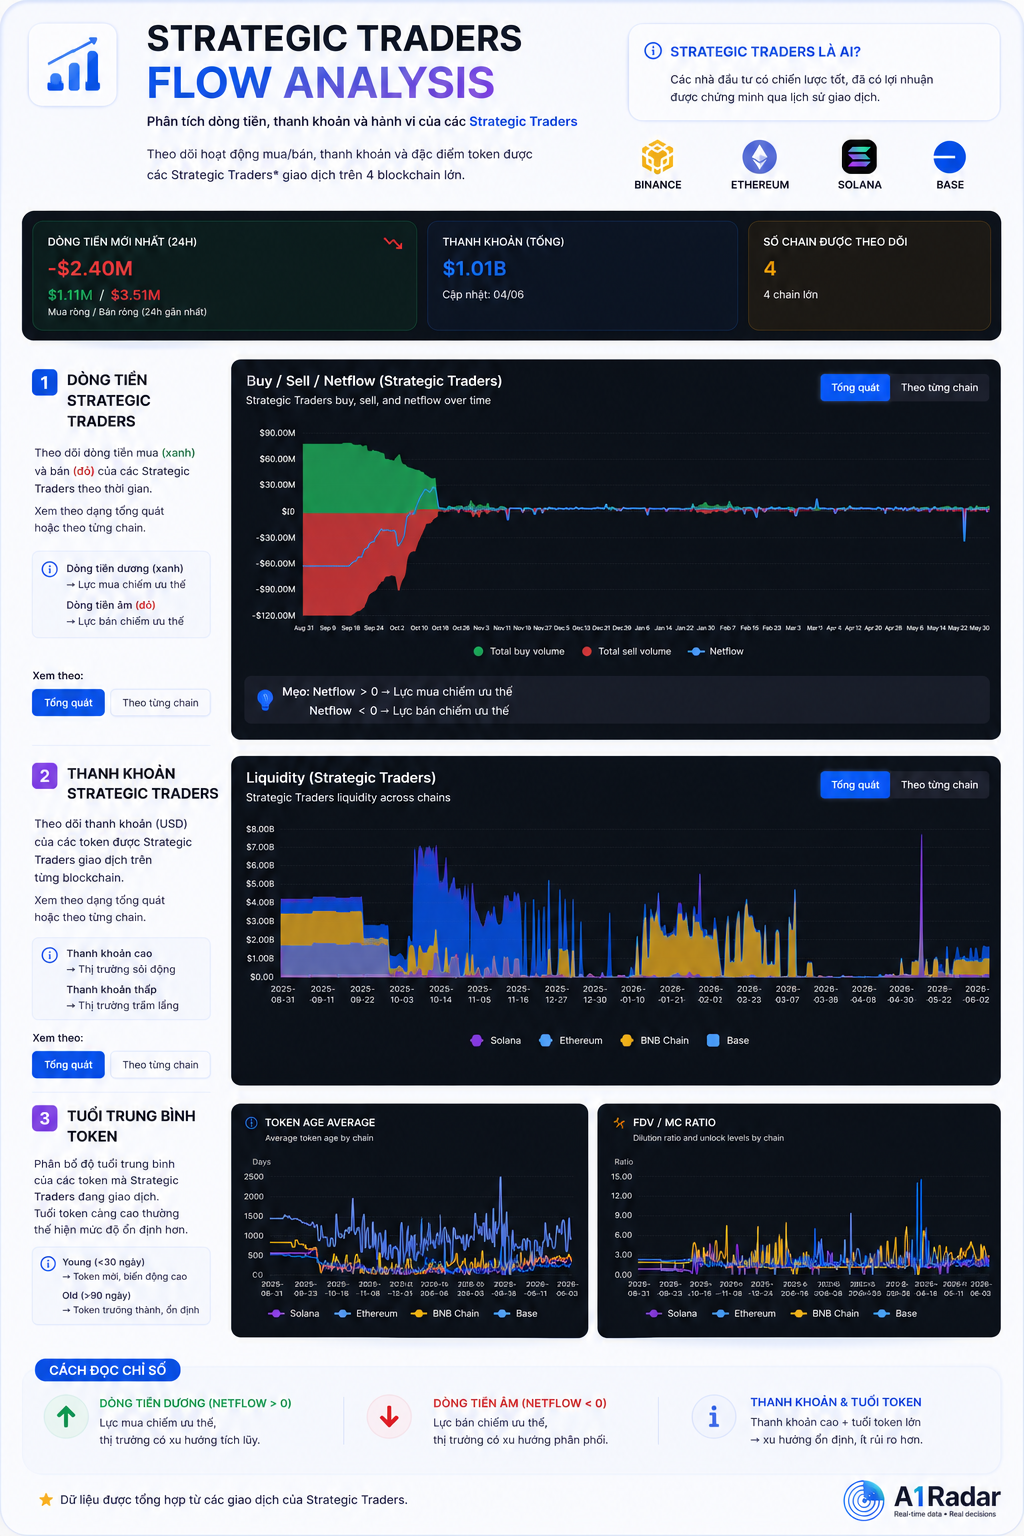
1. 3 Core Charts of Strategic Traders Flow Analysis
The tool evaluates smart money activity through three primary charts:
Chart 1: Transaction Flow (Buy/Sell Flow)
- Tracks buying and selling volumes specifically for the Strategic Traders cohort.
- Supports All Chains aggregate view or Specific Chain detail.
- Helps answer: Is smart money net buying (adding risk) or net selling (exiting market) today?
Chart 2: Liquidity Analysis
- Measures liquidity pool depth fluctuations for the tokens that Strategic Traders are actively trading.
- Expanding liquidity combined with positive buy flow signals healthy capital deployment.
Chart 3: Token Age Distribution
- Measures the average age of tokens traded by this cohort.
- Speculative Bias (< 7 days old): Indicates smart money is actively trading meme seasons or new projects.
- Spot Accumulation Bias (> 30 days old): Indicates capital is rotating back to established protocols.
2. Divergence from General Market Health (Chain Health Index)
- While the Chain Health Index tracks the activity of all market participants (which includes retail noise and system bots), Strategic Traders Flow Analysis isolates the data of vetted, profitable wallets.
- Comparing the general market flow against smart money flow reveals key market phases, such as "Distribution Tops" (where retail buys aggressively but smart money is selling) or "Accumulation Bottoms" (where retail panic-sells but smart money accumulates).
3. Trading Applications
- Confirm Smart Money Trends: A sustainable market wave begins when the Strategic Traders Flow Analysis registers consistent net buying (Buy Flow) over multiple days.
- Filter Ecosystem Trends: Toggle specific blockchain labels below the chart to compare activity levels and find the most active ecosystems.
[!TIP] Ecosystem Selection: Focus your trades on networks showing expanding liquidity and positive inflows from Strategic Traders. Avoid chains showing continuous outflows.