Daily Net Order Flow
Monitor daily net buy/sell transactions on major centralized exchanges (CEX) over the past 30 days.
Last updated: June 19, 2026
Daily Net Order Flow
Daily Net Order Flow measures the daily net difference between active buying volume (Buy Market) and active selling volume (Sell Market) for a specific token on leading centralized exchanges (CEX) over the past 30 days.
1. Understanding Market Orders (Buy vs Sell Market)
Unlike limit orders which sit passively on the orderbook, market orders represent immediate, aggressive trading intent:
- Buy Market (Aggressive Buy): Buyers execute trades immediately at the available ask price. Represents strong demand.
- Sell Market (Aggressive Sell): Sellers execute trades immediately at the available bid price. Represents strong selling pressure.
- Net Order Flow = Total Buy Market Volume - Total Sell Market Volume.
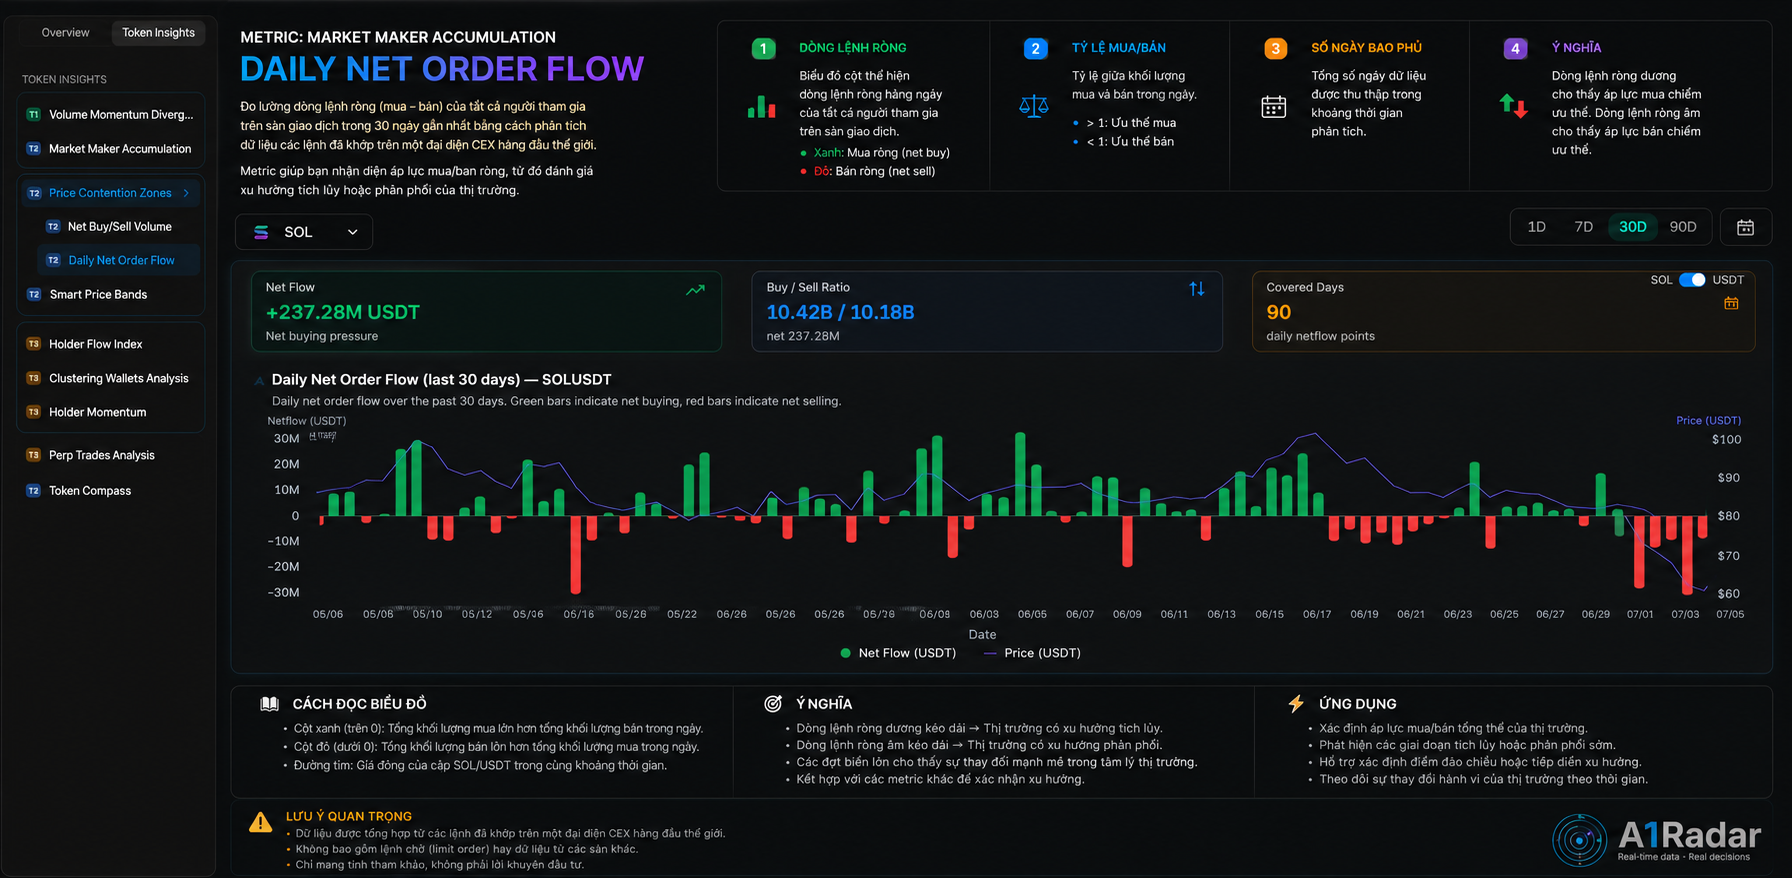
2. How to Read the Chart
The chart displays daily net order differences using colored bars:
- Green Bar (Net Inflow): Active buying volume exceeds active selling volume. Buyers are in control, often leading to upward price movement.
- Red Bar (Net Outflow): Active selling volume exceeds active buying volume. Sellers are dominating, signaling price correction risks.
- Yellow Line: Represents the token's price trend, allowing direct correlation checks between order flows and price performance.
3. Trading Strategies
- Confirm Trend Strength: A healthy price uptrend should be supported by consecutive or expanding green Net Order Flow bars. If price rises but Net Order Flow turns red or shrinks, it indicates a bearish divergence, signaling a potential trend exhaustion.
- Identify Sideways Accumulation: When a token price consolidates within a tight range but displays persistent green bars with moderate volume, smart money is likely accumulating the token passively.
- Absorbing Sell Pressure: If a massive red bar occurs but the price does not fall significantly, followed by immediate green bars, it indicates that buyers are aggressively absorbing all selling pressure (commonly seen during market shakeouts).
[!IMPORTANT] Notes:
- The data is sourced directly from live execution feeds on top centralized exchanges (CEX).
- Consecutive positive net order flows are a reliable leading signal for upcoming price runs.