Chain Health Index
Analyze general market conditions (hot or cold) based on transaction flow, liquidity, and token age distributions across major blockchains.
Chain Health Index
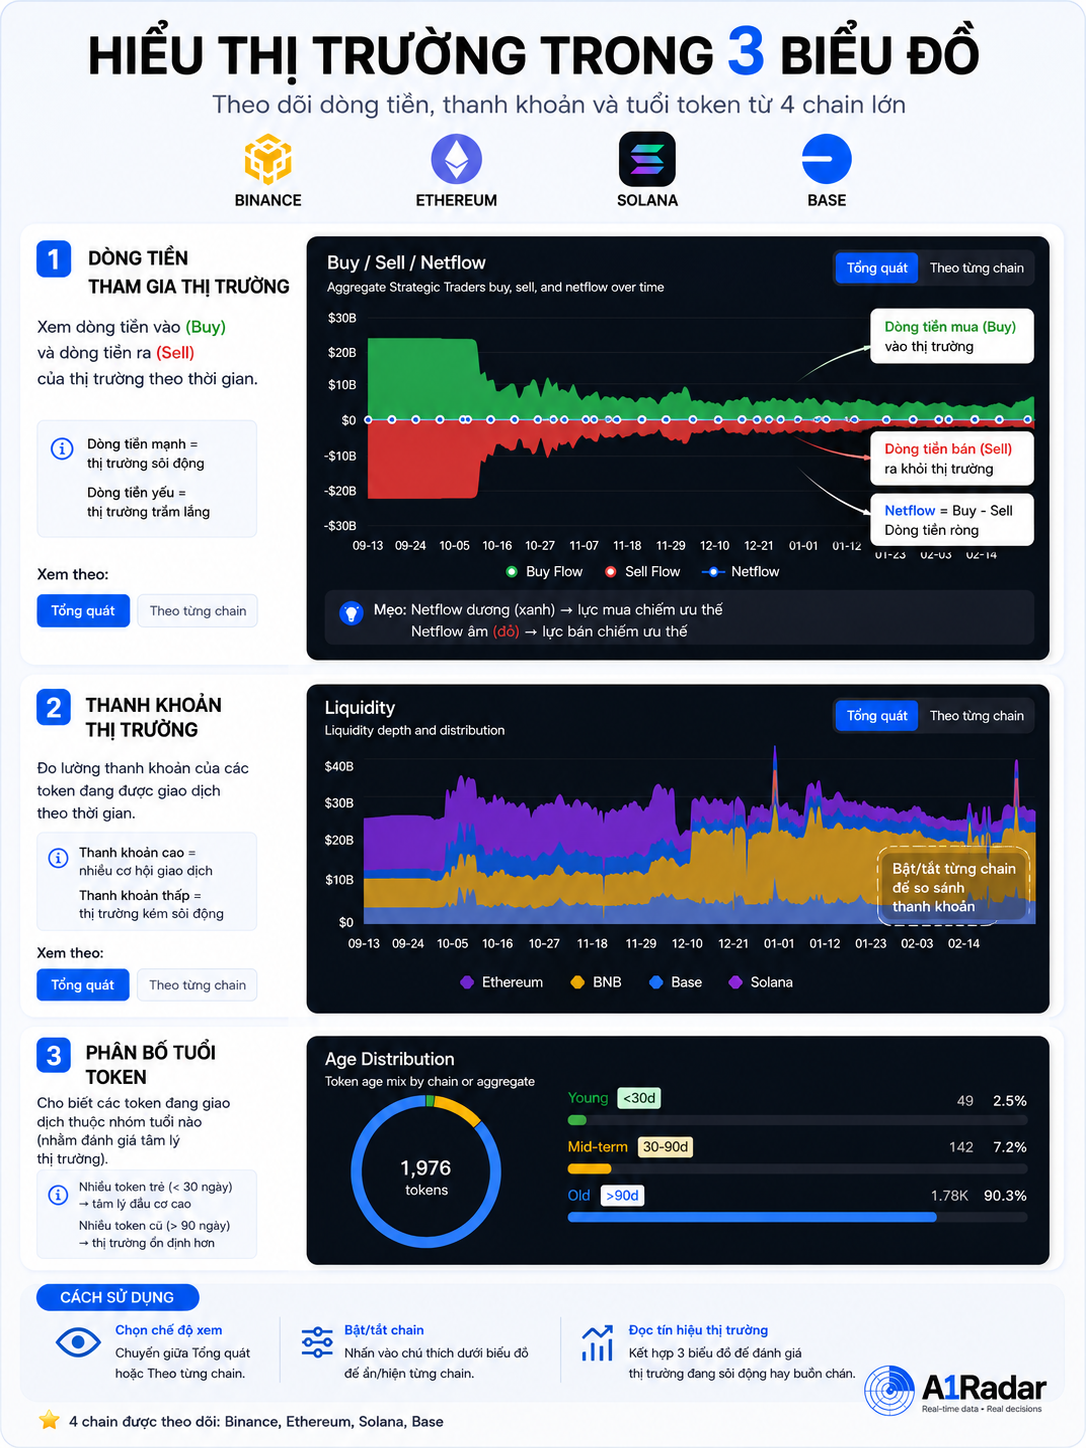
The Chain Health Index is a macro market indicator that measures the overall activity level (hot, warm, or cold) of the crypto market based on capital flows, liquidity depth, and token age distribution across 4 major blockchains: Ethereum, BNB Chain, Solana, and Base.
1. 3 Core Charts of the Chain Health Index
The indicator evaluates network health through three primary components:
Chart 1: Market Capital Flow (Flow Analysis)
Tracks transaction volumes for both buying and selling sides:
- Supports All Chains aggregate view or Specific Chain detail.
- Helps investors locate which network is attracting the most capital, and which force (buyers or sellers) is currently leading.
Chart 2: Liquidity Analysis
Tracks pool depth and liquidity provision:
- Reflects the activity of Liquidity Providers (LPs) across DEXs.
- Expanding liquidity indicates healthy token pools, lower slippage, and incoming new capital.
Chart 3: Token Age Distribution
Measures the age of tokens attracting the most trading volume:
- New Tokens (< 7 days): Reflects speculative activity, meme coin seasons, or newly launched projects.
- Old Tokens (> 30 days): Indicates money flowing back into established, fundamental assets.
2. Practical Applications
- Spot Capital Rotation: If a specific chain (e.g., Base or Solana) displays a persistent positive inflow compared to other networks, capital is actively rotating into that ecosystem. Focus your search for gems there.
- Identify Market Phases:
- Positive Flow + Rising Liquidity + Rising Token Age: Bullish, healthy expansion.
- Negative Flow + Falling Liquidity + Falling Token Age: Bearish, capital is leaving the market or retreating to short-term speculation.
- Legend Filters: On the chart, you can click on the network labels below to toggle specific chains, making it easier to isolate data and compare trends.
[!NOTE] Use Case: This tool is essential for finding which blockchain networks are attracting net inflows, helping you optimize capital allocation.