Realized Price Analysis
Learn how to analyze market cost basis using Realized Price, Balance Price, Delta Price, and Smart Bands.
Last updated: June 19, 2026
Realized Price Analysis
Realized Price Analysis (commonly referred to as the Smart Price Band indicator) is a valuation tool that measures the cost basis of a coin based on its actual on-chain transaction history.
By analyzing when and at what price tokens last moved, this indicator establishes valuation bands. This helps traders identify whether a token is currently overvalued (too expensive) or undervalued (too cheap) compared to the average cost basis of active market participants.
1. 4 Core Concepts on the Chart
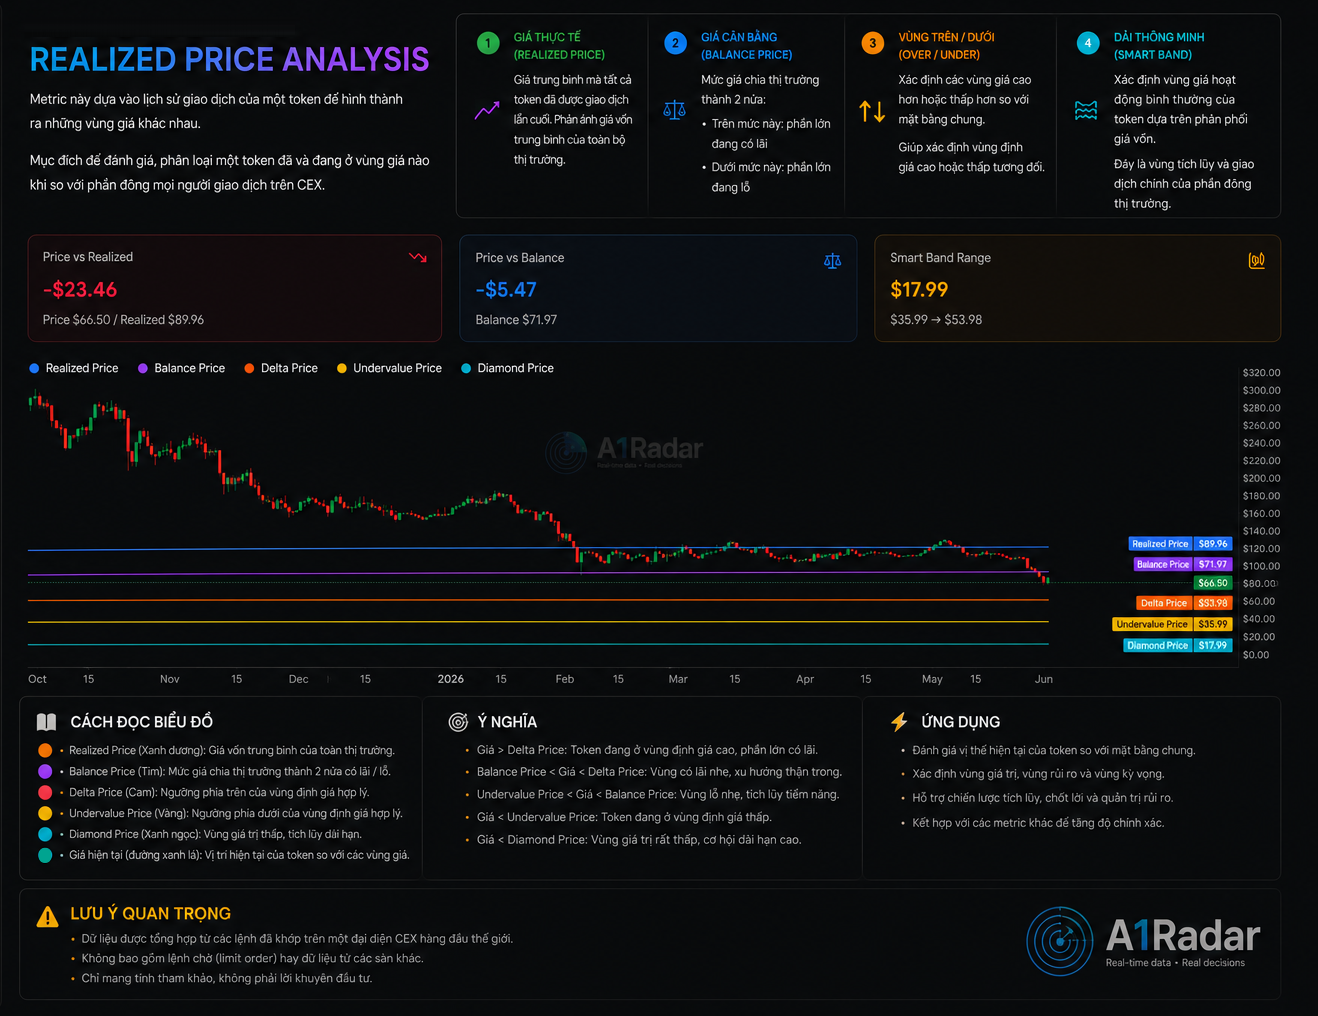
- REALIZED PRICE: Reflects the average cost basis of the entire market. It is calculated by dividing the total value of all tokens at the time they last moved by the circulating supply.
- BALANCE PRICE: Serves as the market polarization point.
- Price above Balance Price: Most holders are currently in profit.
- Price below Balance Price: Most holders are currently in loss.
- OVER / UNDER ZONES: Identifies the relative valuation status of the asset (whether it is too high or too low compared to the market average).
- SMART BAND: The normal price fluctuation range based on historical cost basis distributions. This represents the primary accumulation and trading zone for the majority of market participants.
2. Color Coding of the Price Bands
The Realized Price Analysis chart divides values into colored lines to compare against the current price (represented by the green line):
- Realized Price (Blue Line): The average cost basis of the market.
- Balance Price (Purple Line): The market's break-even point.
- Delta Price (Orange Line): The upper boundary of the fair valuation zone.
- Undervalue Price (Yellow Line): The lower boundary of the fair valuation zone.
- Diamond Price (Turquoise Line): The extremely undervalued zone, presenting an excellent long-term accumulation opportunity.
3. Real-world Applications
VALUATION ZONES MEANING
- Current Price > Delta Price (Orange): The token is in the overvalued zone, and the majority of holders are sitting on large profits. Watch out for potential profit-taking pressure.
- Balance Price (Purple) < Current Price < Delta Price (Orange): The minor profit zone. The trend is healthy with good upward momentum.
- Undervalue Price (Yellow) < Current Price < Balance Price (Purple): The minor loss zone, serving as an accumulation zone for value investors.
- Current Price < Undervalue Price (Yellow): The token is cheap compared to historical cost basis levels.
- Current Price < Diamond Price (Turquoise): The extremely undervalued zone (historical bottom). This represents a high margin-of-safety investment opportunity.
TRADING STRATEGY
- Determine Buying Zones: When the current price touches or goes below the Yellow (Undervalue) and Turquoise (Diamond) lines $\rightarrow$ this is a prime opportunity to apply a Dollar-Cost Averaging (DCA) strategy.
- Determine Profit-taking Zones: When the price stretches far above the Orange line (Delta Price) and short-term indicators show overheated momentum $\rightarrow$ consider taking partial profits.
- Risk Management: Helps you quickly assess if you are FOMO-buying in an overvalued zone relative to the market's cost basis.
[!IMPORTANT] Key Disclaimers:
- Data is aggregated from settled trades across leading centralized exchanges (CEX).
- The chart reflects actual historical executed cost basis, and does not include pending orderbook limit orders.
- This is for technical reference only and does not constitute financial advice.