Clustering Wallets Analysis
Learn how to read the wallet clustering charts and identify anonymous whale accumulation patterns.
Clustering Wallets Analysis
Clustering Wallets Analysis is a deep-dive analytics tool designed to identify and evaluate groups of wallets that share highly similar transaction patterns on a specific token. It tracks these behaviors over 1-day, 1-week, and 1-month timeframes for both buying and selling activities.
By clustering wallets with coordinated behaviors, this tool helps users detect organized trading operations, such as whales splitting transactions across multiple small wallets to avoid detection.
1. Key Metrics on the Dashboard
When accessing the wallet clustering dashboard, pay attention to the following parameters:
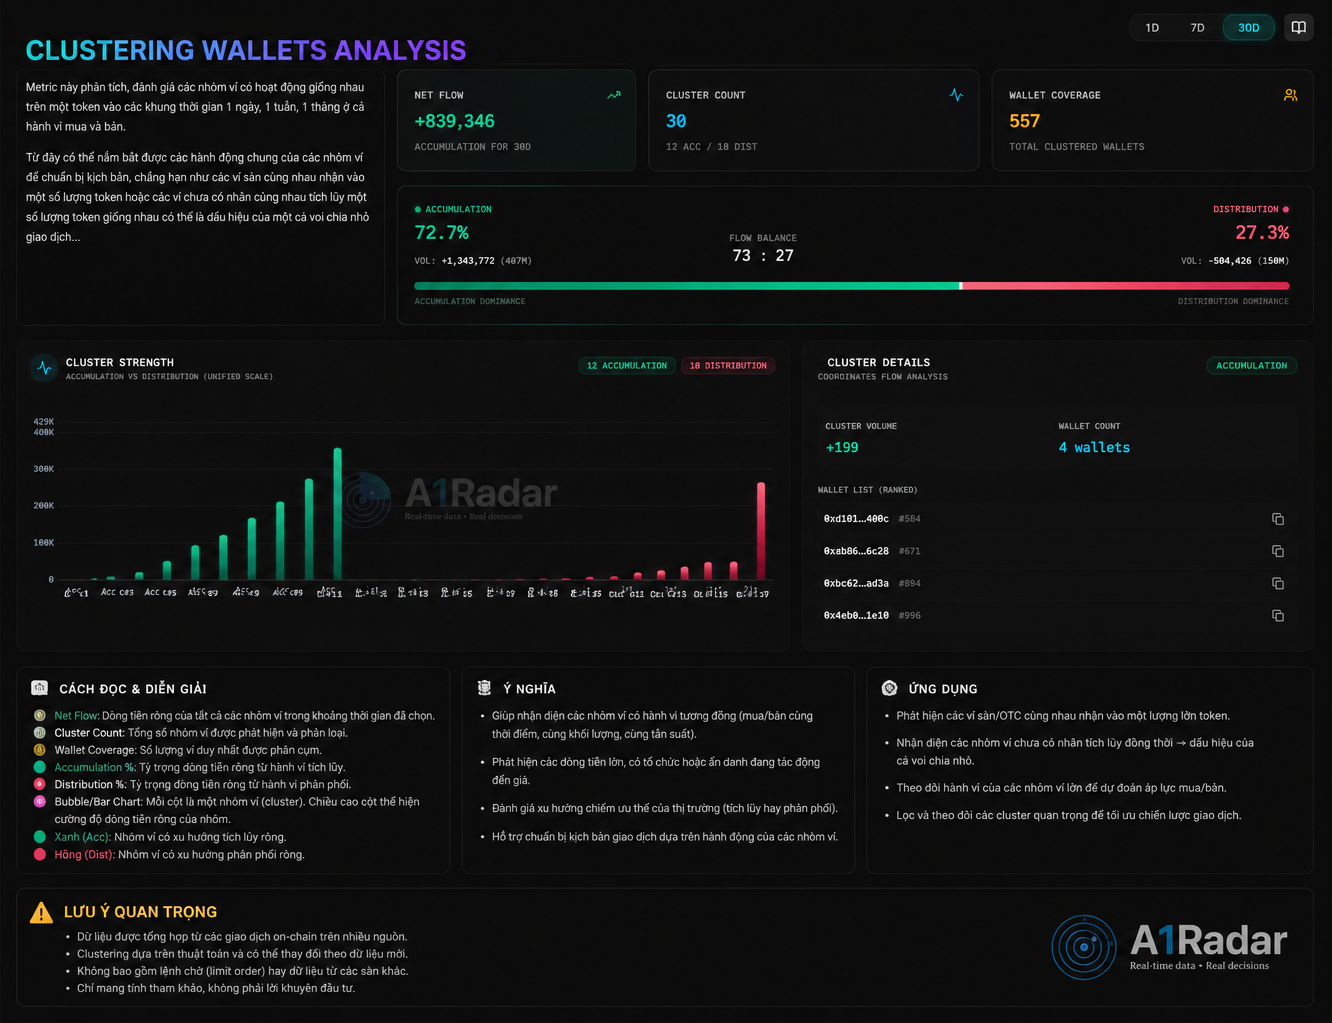
- Net Flow: The total net flow of all wallet clusters in the selected timeframe (e.g., Net Accumulation of +$839\text{k}$ USD over 30 days).
- Cluster Count: The total number of wallet groups (clusters) detected and classified by the algorithm (e.g., 30 clusters, including 12 accumulating clusters and 18 distributing clusters).
- Wallet Coverage: The total number of unique wallet addresses included in the clustering model (e.g., 557 wallets).
- Accumulation vs Distribution Dominance: The percentage representation of which force is currently dominating the market's capital flow.
2. How to Read the Cluster Strength Chart
The chart visualizes the strength of the wallet clusters as bar columns:
- Green Column (Accumulation): Represents wallet groups that show net accumulation behavior (buying more than selling).
- Pink Column (Distribution): Represents wallet groups that show net distribution behavior (selling more than buying).
- Column Height: Shows the net flow intensity of the group. The taller the column, the larger the amount of capital being accumulated or distributed by that cluster.
3. Real-world Applications
KEY INDICATOR SIGNIFICANCE
- Identify Coordinated Behavior: Detect groups of wallets buying/selling at the exact same time, with similar volume and frequency, indicating organized entities.
- Spot Anonymous Smart Money: Pinpoint accumulation activity from large funds or hidden individuals operating through linked wallet networks.
- Evaluate Market Bias: Determine if the actual on-chain flow is leaning toward accumulation or distribution to choose your strategy.
TRADING STRATEGIES
- Detect CEX/OTC Outflows: Quickly identify when multiple unlabeled wallets simultaneously receive large amounts of tokens transferred from exchanges or OTC wallets.
- Spot Split Whales: For example, if a group of 4-5 unlabeled wallets accumulate the exact same amount of tokens simultaneously $\rightarrow$ this is a signature sign of a whale splitting transactions to accumulate silently.
- Monitor Major Clusters: Track the movement of the strongest clusters to predict upcoming market buying/selling pressure.
[!WARNING] Important Disclaimers:
- Data is aggregated from on-chain transactions across multiple networks.
- Clustering results are calculated using machine learning algorithms and may optimize/evolve as new blocks and data arrive.
- This analysis only includes transactions that have been fully settled on-chain, and does not include limit orders pending on CEX orderbooks.