Holder Flow Index
Visualize holder concentration and flow dynamics through bubble maps, accumulation heatmaps, and the Gini index.
Holder Flow Index
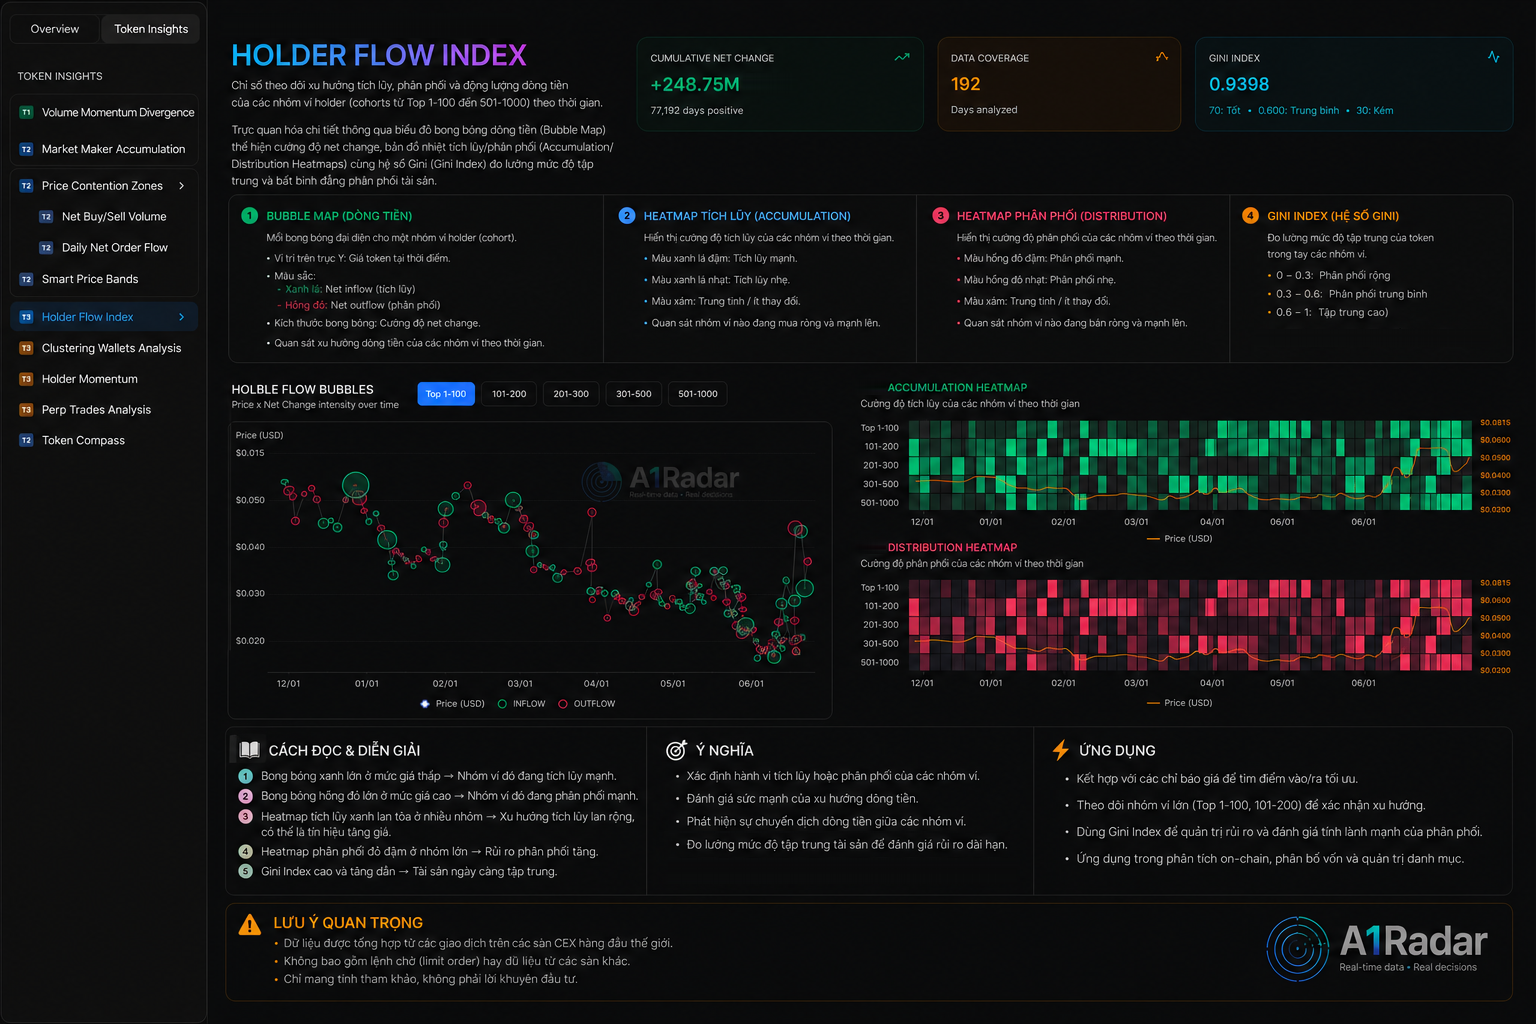
The Holder Flow Index is an advanced analytics tool that visualizes the distribution structure, accumulation/distribution trends, and capital flows of various token holder cohorts (from large whales to retail wallets) over time.
It utilizes modern visualization techniques such as Bubble Maps, Heatmaps, and the Gini Index to measure asset distribution inequality.
1. Holder Cohorts
To filter out noise, wallets are grouped based on their holding rank:
- Top 1 - 100: Whale wallets, having massive influence over the token's market price and liquidity pool.
- Top 101 - 200 & Top 201 - 500: Shark wallets, representing venture capitals, institutions, or high-net-worth individuals.
- Top 501 - 1000: Mid-tier wallets, consisting of active professional traders and early project adopters.
2. Core Visual Components
A. Bubble Map (Capital Flow Intensity)
- Bubble Size: Represents the total token amount or ownership share of the cohort.
- Bubble Color: Indicates the 24-hour net balance change. Bright green represents strong net buying, while bright red indicates net selling.
B. Accumulation/Distribution Heatmaps
Visualizes daily balance changes of each cohort over time as a heatmap grid:
- Helps users detect if accumulation or distribution is happening in consensus across all holder groups, or if it is isolated to a specific cohort.
C. Gini Index
A mathematical coefficient ranging from 0 to 1 that measures wealth concentration:
- Gini close to 1: Supply is highly centralized in a few whale wallets. High risk of manipulation, but prices can pump easily if whales hold.
- Gini close to 0: Supply is evenly distributed among the community. Price discovery is more natural, but large price runs may be harder to initiate due to lack of market makers.
3. Trading Applications
- Spot Accumulation Consensus: The ideal setup is when all cohorts (Top 1 to 1000) display bright green squares on the heatmap simultaneously. This represents a solid foundation for a major upward cycle.
- Identify Whale Dumping on Retail: If Top 1-100 shows bright red (selling) while Top 501-1000 shows green (buying), whales are taking profits and offloading their positions onto smaller participants $\rightarrow$ High risk of an impending trend reversal.
- Use the Gini Index to Align Strategy:
- High Gini ($>0.85$): Suitable for short-term speculation following whale movements.
- Moderate Gini ($0.5 - 0.75$): Suitable for long-term spot investing (DCA).
[!TIP] Pro Tip: Combine this indicator with the Holder Momentum list to track the exact wallet addresses driving these cohort flows.