Gem Radar Scoring System
Learn how to use the Gem Radar feature and interpret the 7 multi-dimensional token health scores.
Last updated: June 19, 2026
Gem Radar Scoring System
Gem Radar is the central hub for discovering and evaluating potential tokens in the market through a multi-dimensional token scoring system and real-time market data.
This feature allows users to quickly filter high-quality assets, analyze the strengths/weaknesses of individual tokens, and visually compare projects within the same sector.
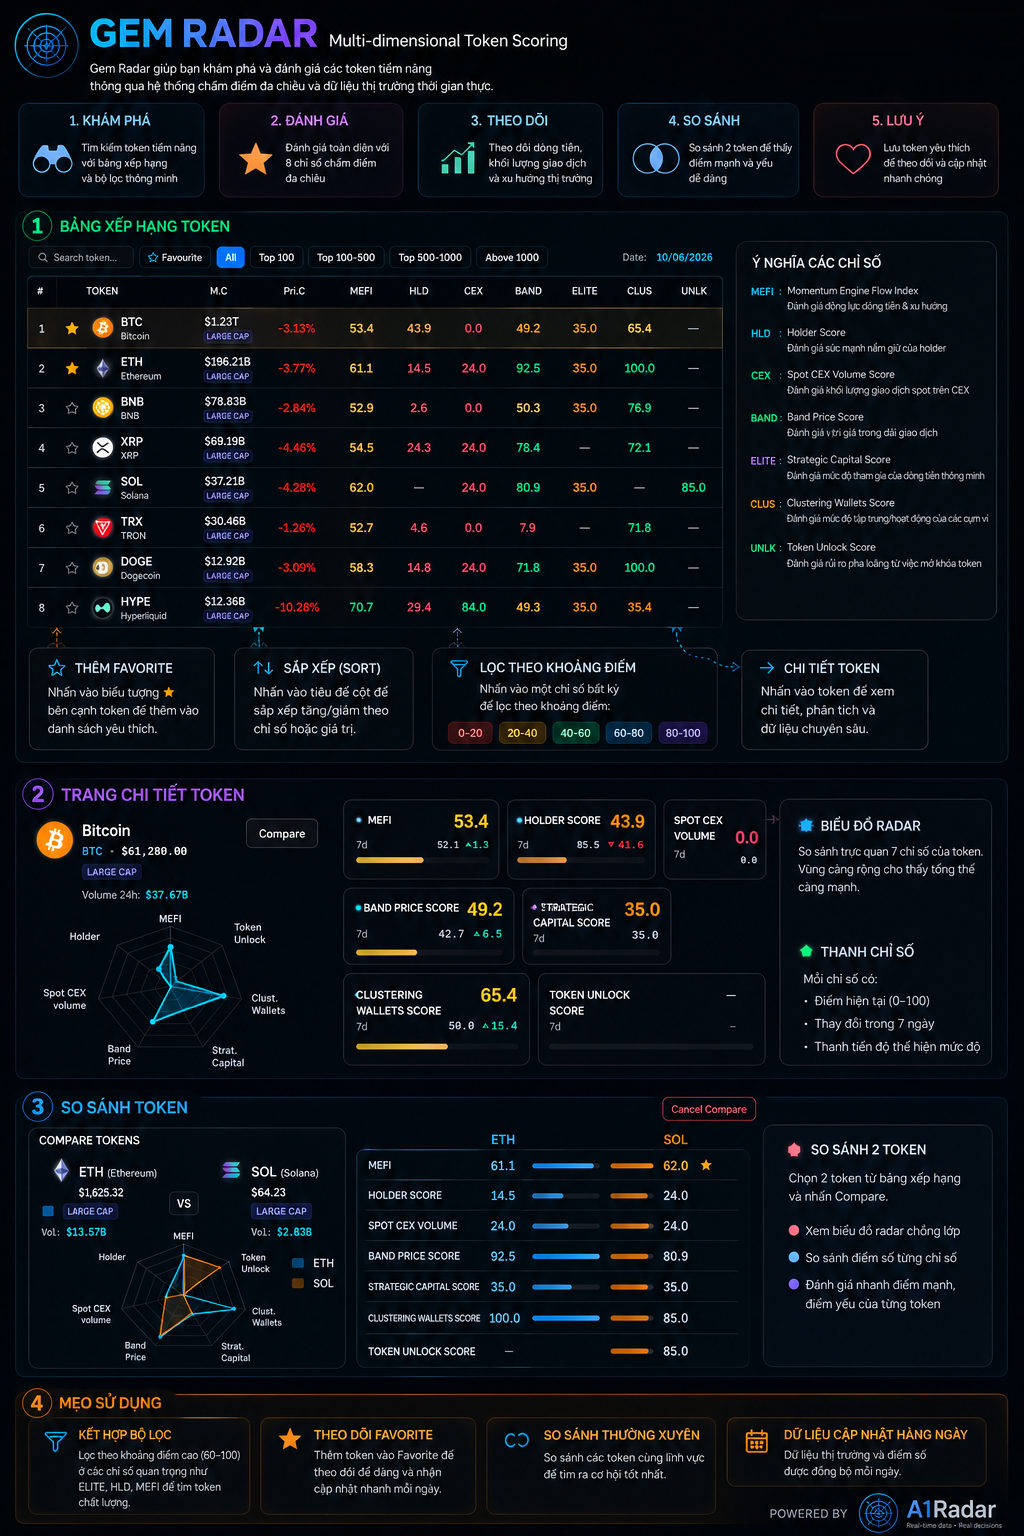
1. 7 Multi-dimensional Indicators
Each token on Gem Radar is scored on a scale from 0 to 100 across 7 independent indicators:
- MEFI (Momentum Engine Flow Index): Evaluates the token's money flow momentum and trend strength. A high score indicates sustainable growth and strong capital inflows.
- HLD (Holder Score): Measures the holding conviction of token holders. High scores suggest that holders prefer to hold long-term, reducing immediate selling pressure.
- CEX (Spot CEX Volume Score): Evaluates the spot trading volume of the token on major centralized exchanges.
- BAND (Band Price Score): Assesses the current price position of the token relative to historical price bands (whether it is undervalued or overvalued).
- ELITE (Strategic Capital Score): Measures the accumulation activity of venture capitals, institutional funds, and professional traders (Smart Money).
- CLUS (Clustering Wallets Score): Evaluates the concentration and coordinated purchasing behavior of anonymous wallet clusters.
- UNLK (Token Unlock Score): Measures supply inflation risk and selling pressure originating from upcoming token unlocks.
2. Core Dashboard Features
A. TOKEN RANKING
- Search & Sort: Quickly search for any token or sort rankings based on a specific indicator score.
- Score Filters: Filter tokens by specific score ranges (e.g., show only tokens with a BAND score between
70 - 100to find undervalued projects). - Add to Favorites: Star projects to put them into your Watchlist for quick monitoring.
B. RADAR CHART
When clicking on a token, the system renders a Radar Chart (Spider Chart) comparing the 7 metrics:
- Green Area Coverage: The larger the covered area, the healthier the project's overall money flow and financial metrics.
- Progress Indicators: Shows the current score, the 7-day score delta, and a visual progress bar.
C. COMPARE TOKENS
Allows users to select and compare two tokens side by side:
- Overlaid Radar Charts: Visually compare the strengths and weaknesses of two projects (e.g., comparing ETH and SOL).
- Metrics Table Comparison: Shows detailed side-by-side scores to help analyze which token has the upper hand in each area.
3. Trading Tips
- Combine Filters: Scan for tokens with ELITE $\ge 60$ (accumulated by smart money) and HLD $\ge 60$ (high holder conviction) to find reliable mid-term spot opportunities.
- Compare Competitors: When debating between two projects in the same sector (e.g., Layer 1s or DeFi), use the Compare tool to see which asset has better money flow momentum (MEFI).
- Update Cadence: Scores are recalculated daily based on the latest on-chain developments.