Net Buy/Sell by Price Range
Identify on-chain support and resistance levels by analyzing net buy/sell volumes across price levels.
Net Buy/Sell by Price Range
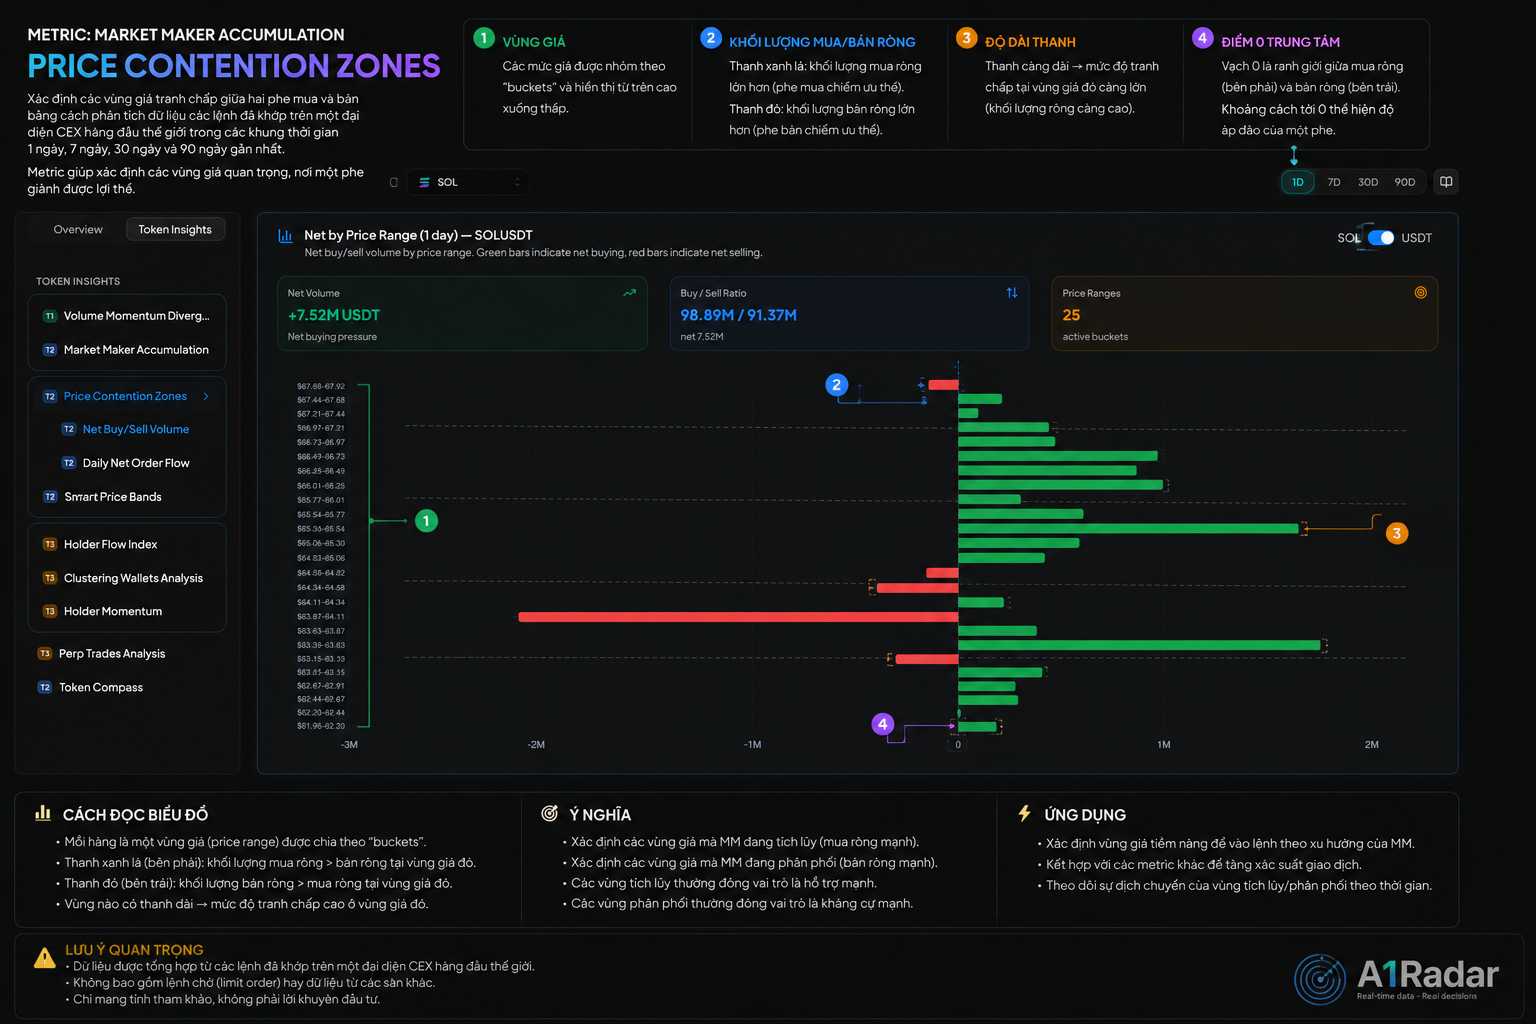
Net Buy/Sell by Price Range (also known as Price Contention Zones) is a volume profile tool that maps support and resistance levels based on historical trade settlement data on major exchanges (CEX) over 1-day, 7-day, and 30-day periods.
1. What are Price Contention Zones?
Standard technical analysis charts draw support and resistance lines using peak prices. The Net Buy/Sell by Price Range indicator instead maps these levels based on actual traded volume profiles:
- Major Net Buy Zone (Green Bars): Price levels where buyers aggressively absorbed supply and pushed the price up. This serves as a solid on-chain support level.
- Major Net Sell Zone (Red Bars): Price levels where sellers took profits or cut losses aggressively. This serves as a strong on-chain resistance level.
2. Reading the Volume Profile Chart
The chart displays net volumes horizontally against price levels:
- Green Bar (Net Buy): Net buying volume exceeded selling volume at that price.
- Red Bar (Net Sell): Net selling volume exceeded buying volume at that price.
- Bar Length: Represents the total transaction volume at that price level. Longer bars indicate high-volume contention zones where major buying or selling occurred.
3. Trading Applications
A. Locate Entry Points
When a token price drops toward a price level containing the longest green Net Buy bar $\rightarrow$ this acts as a highly reliable support zone, as it represents the cost basis of large buyers who are likely to defend their positions. This provides a high risk-to-reward (R:R) buying entry.
B. Locate Take-Profit Targets
When the price rises near a price level containing the longest red Net Sell bar above $\rightarrow$ expect heavy selling pressure from profit-takers. Consider taking partial profits or avoiding breakout FOMO as the price approaches this zone.
C. Confirm Breakouts
- If the price breaks above the longest red Net Sell bar backed by positive Net Order Flow $\rightarrow$ resistance has successfully flipped to support, validating the breakout.
[!TIP] Pro Tip: Toggle between the 7-day and 30-day timeframes to find the most significant "Volume Clusters" for high-accuracy support and resistance mapping.