Momentum Engine Flow Index (MEFI)
Analyze market maker flows and price momentum using the proprietary MEFI indicator.
Last updated: June 19, 2026
Momentum Engine Flow Index (MEFI)
The Momentum Engine Flow Index (MEFI) is a proprietary, state-of-the-art indicator on A1Radar. It is designed to track active capital deployment and price pump signals triggered by market makers (MM).
MEFI helps decode explosive token rallies by monitoring the exact entry, accumulation, and withdrawal of MM capital.
1. 2 Components of the MEFI Indicator
The indicator consists of two primary visual panels:
Panel 1: Capital Inflow & Price Momentum (MEFI Trend & Accumulation)
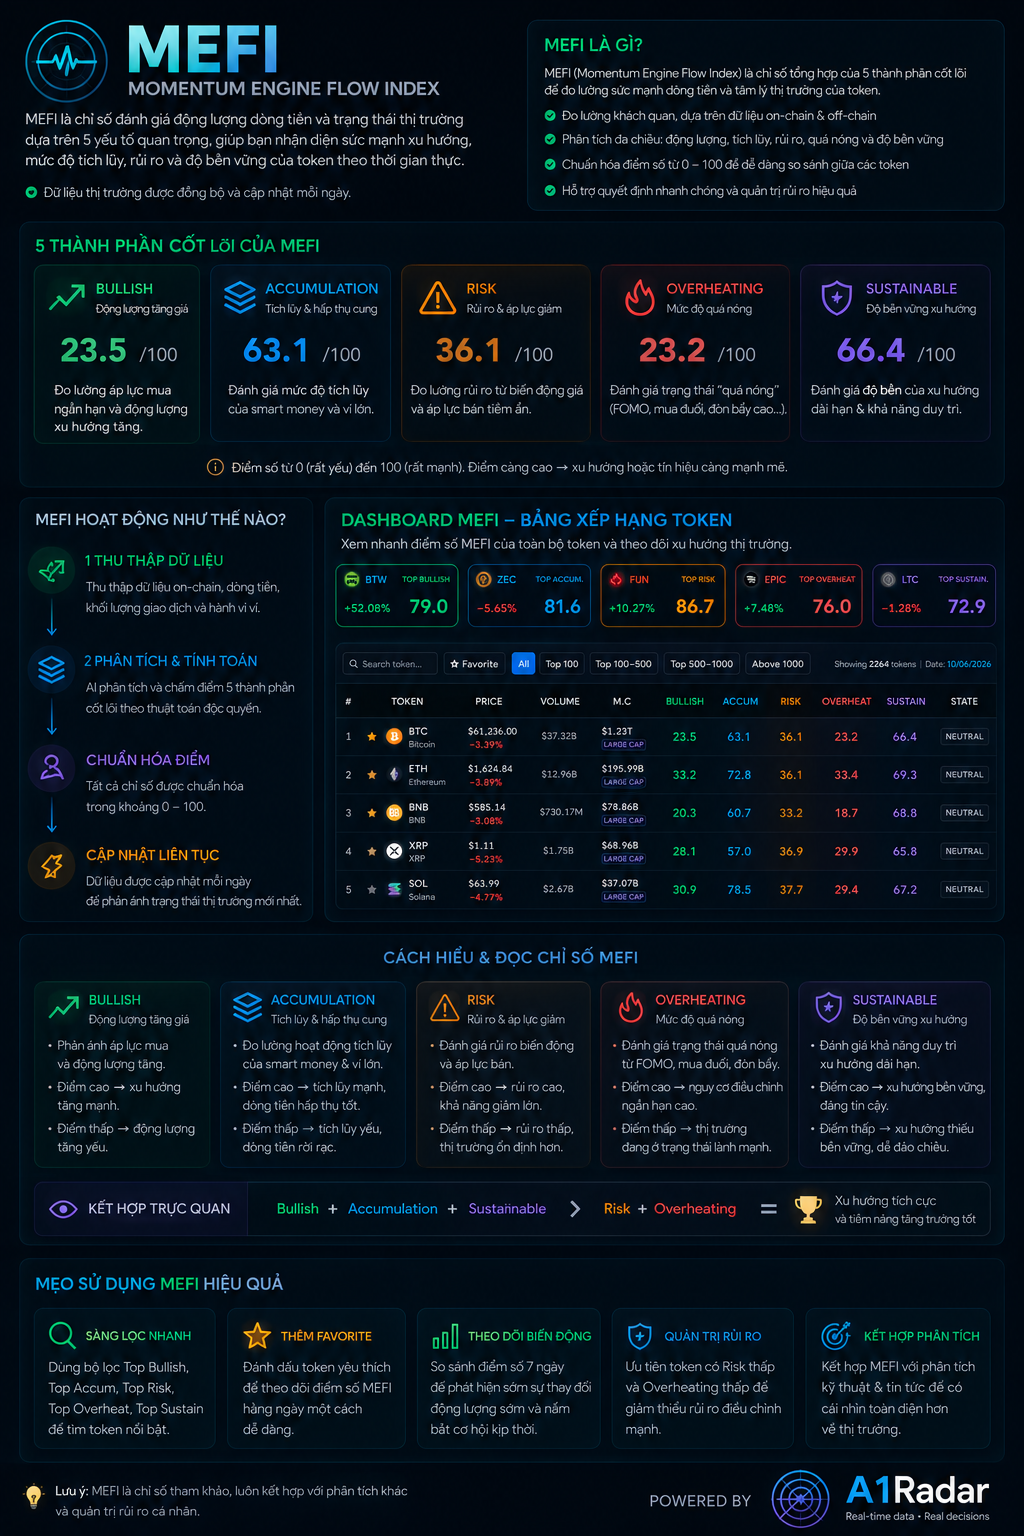
- MEFI Trend Line: Represents the cumulative net flow of market maker capital.
- Push Signals: When the MEFI line slopes upward and transitions into the bright green zone, it indicates that MMs are actively injecting capital to trigger or sustain a major price pump.
Panel 2: Trade Depth & Flow Profile (MEFI Liquidity & Volume Profile)
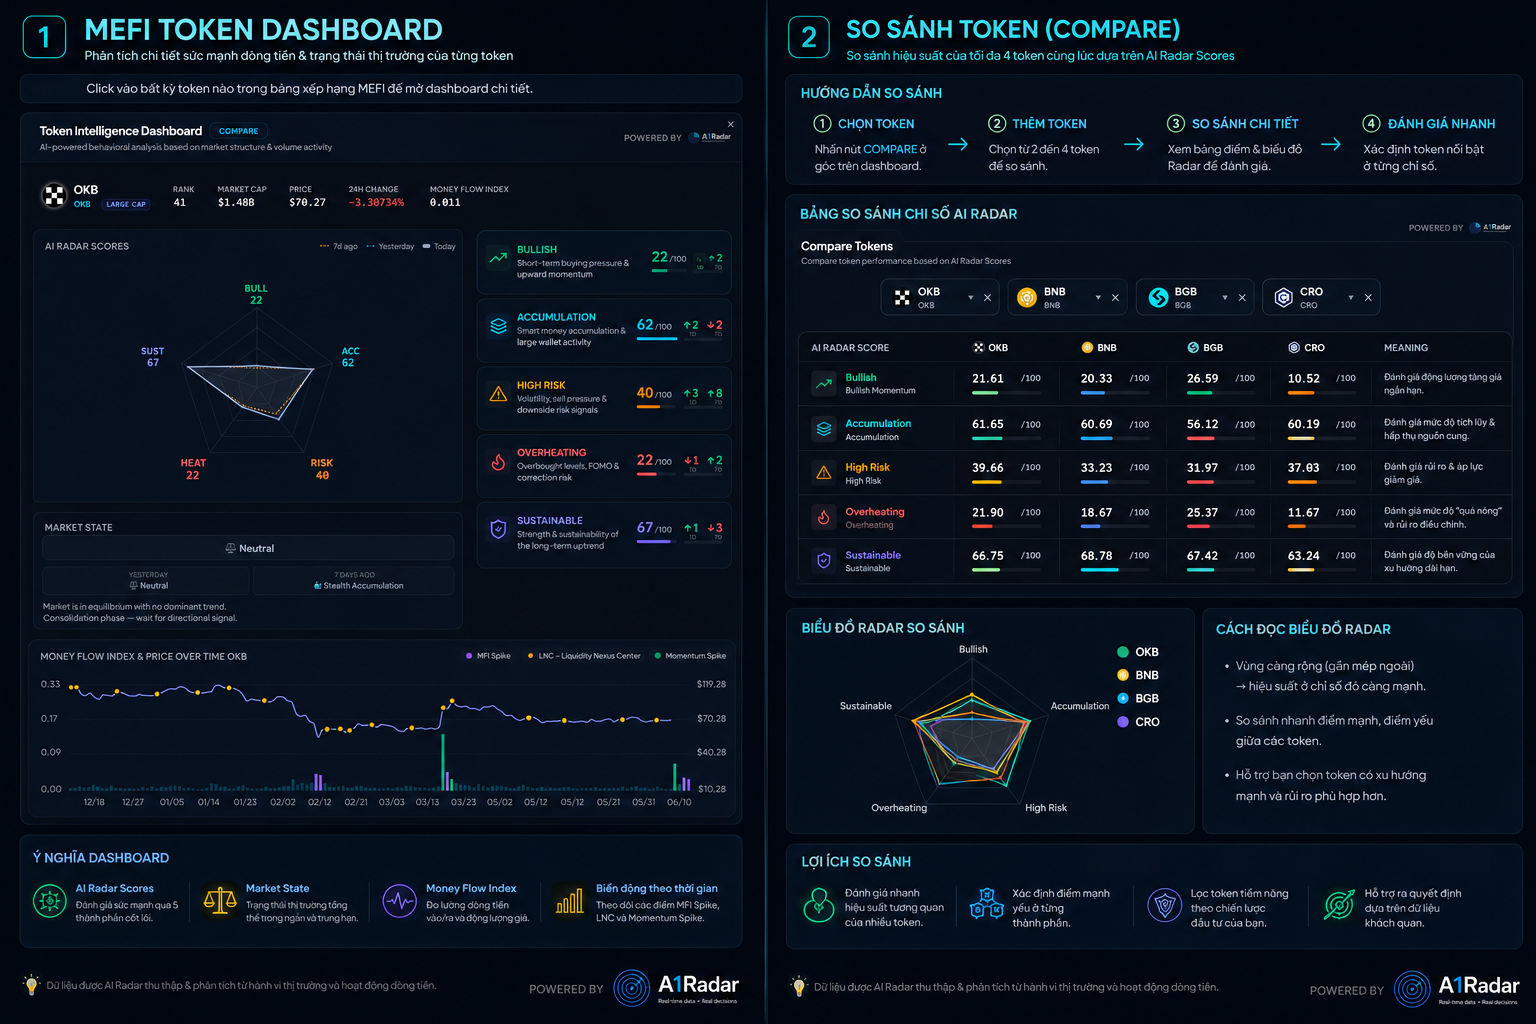
- Active Trade Executions: Compares the real-time Buy Market and Sell Market volume generated by market makers.
- Helps users verify whether a rally is backed by genuine trading volume or just wash trading.
2. Reading MEFI Phases
Based on historical data from tokens like BNB, OKB, and BGB, MEFI signals follow three key market phases:
- Silent Accumulation Phase: Price consolidates in a range with low volume, but the MEFI line starts a gradual upward trend. This represents MMs accumulating positions quietly.
- Markup Phase (Push Trigger): The MEFI indicator spikes and enters the strong green zone. Price breaks out of the consolidation range with expanding volume.
- Distribution/Cooling Phase: Price continues to rise or consolidates at peak levels, but the MEFI line curves downward and turns red $\rightarrow$ Warning of MM profit-taking, indicating high reversal risks.
3. Trading Applications
- Filter Potential Tokens (MEFI Scanner): Scan for tokens where the MEFI indicator is transitioning from Negative (Red/Weak) to Positive (Green/Strong) alongside expanding volume.
- Confirm Breakouts: Only trade key resistance breakouts if the MEFI line is pointing upward in a steep angle, validating the presence of market maker backing.
- Position Management: If you hold a token and the MEFI trend turns down consistently for several days $\rightarrow$ Consider locking in profits to avoid holding the token through the MM distribution phase.
[!IMPORTANT] Key Takeaway:
- The MEFI trend line acts as a leading indicator of MM behavior, which often reacts faster than traditional technical indicators like RSI or MACD.
- Combine MEFI with Market Maker Accumulation to find high-probability trade opportunities.